
TW Market Brief · August 24, 2026 · Orange & Los Angeles Counties
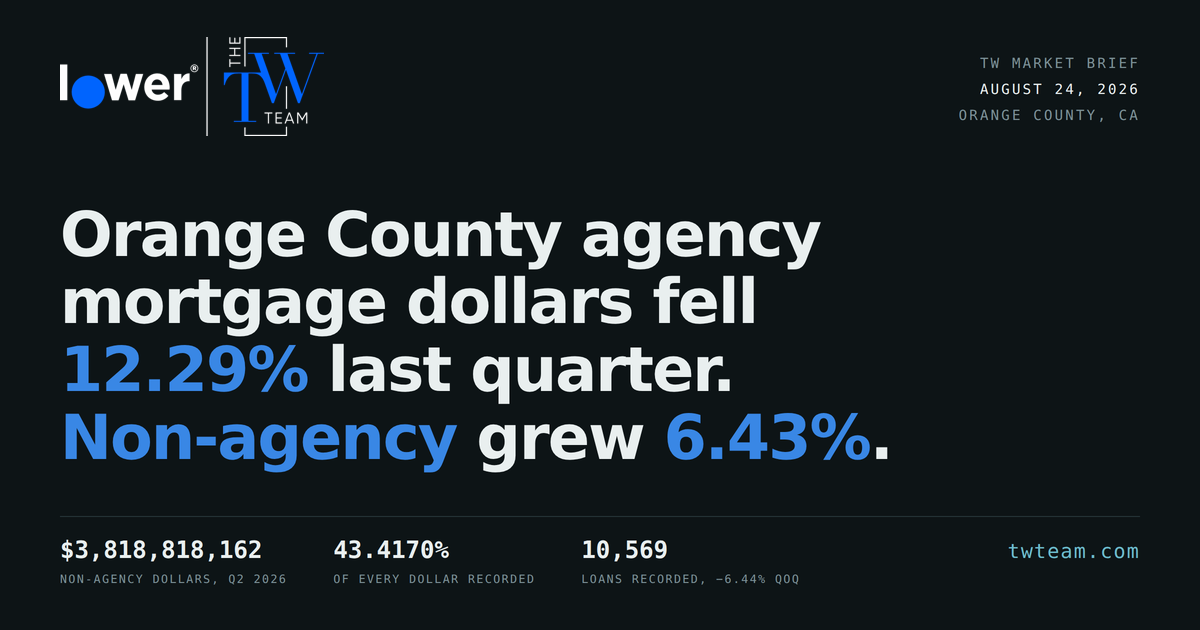
Non-agency lenders wrote $3,818,818,162 of the $8,795,681,056 in mortgages recorded in Orange County, California in the second quarter of 2026 — 43.4170% of every dollar, the highest share of the seven complete quarters since the fourth quarter of 2024, according to ModelMatch county recording data retrieved on August 24, 2026. That happened in a quarter when the county’s total loan count fell. Orange County recorded 10,569 mortgages in the second quarter of 2026, down 6.44% from 11,296 in the first quarter. Agency lending absorbed the entire decline and then some: agency dollars fell 12.29% while non-agency dollars rose 6.43%.
Two things make this worth a second look rather than a shrug. First, Orange County loan counts have risen from the first quarter to the second quarter in every one of the three prior years — 25.91% in 2023, 24.05% in 2024, 21.75% in 2025. A 6.44% decline is not a seasonal pattern; it is a break in one. Second, it happened while the 30-year fixed mortgage rate was falling, to 6.65% on Thursday, August 20, 2026, in the same week the 30-year U.S. Treasury closed at its highest level since 2007.
First, which threshold we mean
Orange County and Los Angeles County are both Federal Housing Finance Agency high-cost areas, and there are three rungs on the ladder, not two. The baseline conforming limit for a one-unit property in 2026 is $832,750. Above that, and up to the high-cost ceiling of $1,249,125, sits high-balance conforming — still an agency loan, still delivered to Fannie Mae or Freddie Mac, but priced higher and underwritten to tighter overlays. Only above $1,249,125 does a borrower reliably leave agency territory for jumbo or non-agency. The Federal Housing Finance Agency announced both 2026 figures on November 25, 2025.
Every “agency” figure in this brief counts baseline and high-balance conforming together. Every “non-agency” figure is the genuinely non-agency set: roughly 97% of those loans sit above the $1,249,125 ceiling. When someone tells you Orange County is a jumbo market, ask which rung they mean — the answer changes the pricing conversation by a wide margin.
Key findings
- Non-agency lending took $3,818,818,162 of the $8,795,681,056 in mortgages recorded in Orange County, California in the second quarter of 2026 — 43.4170% of every dollar, the highest of the seven complete quarters since the fourth quarter of 2024.ModelMatch county recording data, retrieved August 24, 2026
- Orange County recorded 10,569 mortgages in the second quarter of 2026, 6.44% fewer than the 11,296 recorded in the first quarter — the first first-quarter-to-second-quarter decline in four years, against gains of 25.91% in 2023, 24.05% in 2024 and 21.75% in 2025.ModelMatch county recording data, retrieved August 24, 2026
- The entire contraction was agency. Orange County agency dollars fell 12.29% quarter over quarter, from $5,673,946,749 to $4,976,862,894, while non-agency dollars rose 6.43%, from $3,588,140,204 to $3,818,818,162.ModelMatch county recording data, retrieved August 24, 2026
- The average Orange County non-agency loan recorded in the second quarter of 2026 was $2,193,462; the average agency loan — baseline and high-balance conforming combined — was $563,758. The non-agency loan is 3.89 times larger.ModelMatch county recording data, retrieved August 24, 2026
- The 30-year fixed mortgage rate averaged 6.65% on Thursday, August 20, 2026, a second consecutive weekly decline, in the same week the 30-year U.S. Treasury constant-maturity yield reached 5.31% on Monday, August 17, 2026 — its highest daily reading since 2007.Freddie Mac Primary Mortgage Market Survey, August 20, 2026; Federal Reserve H.15 / U.S. Treasury daily par yield curve
- The 30-year mortgage rate’s premium over the 10-year U.S. Treasury narrowed to 196 basis points on Thursday, August 20, 2026, from 225 basis points on Thursday, August 21, 2025 — 29 basis points of spread compression absorbing a 36-basis-point rise in the 10-year yield.Freddie Mac Primary Mortgage Market Survey and Federal Reserve H.15, Thursday-aligned closes
- Fitch Ratings put 30-plus-day delinquency in the NQM/Non-Prime 2.0 sector at 7.26% and 90-plus-day delinquency at 3.61% on February 2026 remittance data, up 118 and 81 basis points year over year respectively. No Fitch monitor with a more recent as-of date had been published in the trade press as of August 24, 2026.Fitch Ratings U.S. RMBS Performance Monitor, February 2026 remittance data; covered March and April 2026
Where the line moved: Orange County broke a four-year seasonal pattern
Orange County recorded 10,569 mortgages in the second quarter of 2026, 6.44% fewer than the 11,296 recorded in the first quarter — the first first-quarter-to-second-quarter decline in four years, per ModelMatch county recording data retrieved on August 24, 2026. The three prior years all moved the other way, and by more than twenty percent each time.
Orange County, California: percentage change in mortgages recorded from the first quarter to the second quarter, 2023 through 2026. Source: ModelMatch county recording data, retrieved August 24, 2026. Every plotted value appears in the table below.
| Year | Q1 loans | Q2 loans | Change | Q1 dollars | Q2 dollars | Change |
|---|---|---|---|---|---|---|
| 2023 | 6,562 | 8,262 | +25.91% | $4,270,639,443 | $5,534,757,185 | +29.60% |
| 2024 | 6,931 | 8,598 | +24.05% | $4,748,187,232 | $5,983,083,855 | +26.01% |
| 2025 | 8,234 | 10,025 | +21.75% | $6,032,703,878 | $7,777,585,052 | +28.92% |
| 2026 | 11,296 | 10,569 | -6.44% | $9,262,086,953 | $8,795,681,056 | -5.04% |
Method: the most recent partial quarter (third quarter 2026) and the leading partial quarter at the edge of the 24-month window are both excluded from every figure in this brief. County recordings lag, and a partial quarter reads as a collapse.
The dollars tell the same story with the composition attached. Agency volume in Orange County fell from $5,673,946,749 in the first quarter of 2026 to $4,976,862,894 in the second — a 12.29% decline. Non-agency volume rose from $3,588,140,204 to $3,818,818,162, up 6.43%. Agency loan count fell 8.29%; non-agency count rose 4.25%. There is no reading of that in which the two halves of the market are doing the same thing.
Orange County, California mortgage dollars recorded by quarter, agency versus non-agency, fourth quarter 2024 through second quarter 2026. Source: ModelMatch county recording data, retrieved August 24, 2026. Every plotted value appears in the table below.
| Quarter | Loans recorded | Total dollars | Agency dollars | Non-agency dollars | Non-agency dollar share |
|---|---|---|---|---|---|
| Q4 2024 | 10,140 | $7,397,553,735 | $4,603,429,761 | $2,794,123,974 | 37.7709% |
| Q1 2025 | 8,234 | $6,032,703,878 | $3,553,751,751 | $2,478,952,127 | 41.0919% |
| Q2 2025 | 10,025 | $7,777,585,052 | $4,464,550,830 | $3,313,034,222 | 42.5972% |
| Q3 2025 | 8,281 | $6,399,927,745 | $3,735,901,742 | $2,664,026,003 | 41.6259% |
| Q4 2025 | 11,152 | $9,123,635,559 | $5,557,131,694 | $3,566,503,865 | 39.0908% |
| Q1 2026 | 11,296 | $9,262,086,953 | $5,673,946,749 | $3,588,140,204 | 38.7401% |
| Q2 2026 | 10,569 | $8,795,681,056 | $4,976,862,894 | $3,818,818,162 | 43.4170% |
One in six Orange County loans is non-agency. Those loans carry 43.4170% of the dollars. Los Angeles County is directionally the same and materially smaller: 37.8241% of Los Angeles County mortgage dollars recorded in the second quarter of 2026 were non-agency, on an average loan size of $766,124 across 26,338 loans, against Orange County’s $832,215 across 10,569.
Prices did not follow the loan count down. The median price of an existing single-family home in Orange County, California was $1,475,000 in July 2026, up 5.4% from $1,400,000 in July 2025, with an unsold inventory index of 3.1 months and a median 26.0 days on market, per the California Association of Realtors report released on August 17, 2026. Fewer loans, higher prices, larger loans. That is the shape of a market where the binding constraint is supply and the financing is climbing the ladder.
The rate backdrop: mortgage rates fell while the long bond broke
The 30-year fixed mortgage rate averaged 6.65% on Thursday, August 20, 2026, its second consecutive weekly decline, per Freddie Mac’s Primary Mortgage Market Survey. The 15-year averaged 5.95%. Over the same span the 10-year U.S. Treasury rose: 4.69% on Thursday, August 20, 2026, against 4.33% on Thursday, August 21, 2025.
| Thu Aug 20, 2026 | Thu Aug 13, 2026 | Thu Aug 21, 2025 | |
|---|---|---|---|
| 30-year fixed mortgage (Freddie Mac PMMS) | 6.65% | 6.67% | 6.58% |
| 15-year fixed mortgage (Freddie Mac PMMS) | 5.95% | 5.96% | 5.69% |
| 10-year U.S. Treasury (constant maturity) | 4.69% | 4.63% | 4.33% |
| 30-year U.S. Treasury (constant maturity) | 5.23% | 5.21% | 4.92% |
| 30-year mortgage over 10-year Treasury | 196 bps | 204 bps | 225 bps |
Source note: mortgage rates are Freddie Mac Primary Mortgage Market Survey weekly averages, released Thursdays. Treasury yields are constant-maturity daily closes from the Federal Reserve H.15 release and the U.S. Treasury daily par yield curve, which agreed to the basis point on every date shown. All four series are Thursday closes, spaced exactly 7 and 364 days apart. Thursday rather than Friday alignment was used deliberately: as of the morning of August 24, 2026, neither H.15 nor the Treasury feed had published Friday, August 21, 2026 — the H.15 release dated August 21 carries data through August 20. Using a Thursday set keeps every column on the same weekday and on the same publication basis as the mortgage survey. Spreads are computed from the unrounded published values on each date.
Our own TW Rate Environment Score — a 0-to-100 reading built from the 10-year Treasury yield, Federal Reserve policy, inflation trends and market volatility — was 51 out of 100, Balanced, for the week of August 21, 2026, down 4 points from 55 the prior week on what the report calls a volatile, more hawkish week. The TW Rate Report puts the 10-year Treasury at 4.71% as of Friday, August 21, 2026 — one day past the Thursday alignment used in the table above, and shown separately for that reason.
The 30-year U.S. Treasury constant-maturity yield reached 5.31% on Monday, August 17, 2026 — its highest daily reading since 2007. Intraday dealer quotes ran higher still on Tuesday, August 18, but those are quotes rather than the constant-maturity fix, and the fix is what is quoted here. On Wednesday, August 19, the Federal Reserve released the minutes of the July 28–29, 2026 meeting, which recorded a 9–3 hold with Cleveland’s Beth Hammack, Minneapolis’s Neel Kashkari and Dallas’s Lorie Logan all dissenting in favor of a quarter-point increase. The minutes state that “many participants assessed that policy tightening would likely be necessary if inflation did not decline.” The federal funds target range remains 3.50% to 3.75%.
Also on August 19, the Treasury announced it will roughly double the maximum size of its nominal long-end liquidity support buybacks, from $2 billion to at least $4 billion per operation, beginning September 9, 2026. Treasury framed the increase on “consistent strong sponsorship from market participants,” not on stress. Press coverage read more urgency into it than the release contains; we are reporting the release.
The national Non-QM picture: bigger, and deteriorating at the edges
Non-QM is now a roughly $175 billion origination market in 2026 by Bank of America Securities’ projection, and crossed more than 10% of all mortgage rate locks in July 2026, up 1.4 percentage points month over month and more than 2 percentage points year over year, per Optimal Blue’s July 2026 Market Advantage release. Optimal Blue publishes that share as “more than 10%” rather than a decimal, and outlet coverage of the June figure does not agree on one, so no decimal is stated here. Within those July non-QM locks, investor and debt-service-coverage-ratio product was 33.5% and bank statement product was 30.6%, per National Mortgage Professional’s August 11, 2026 coverage.
Securitization has kept pace. Bank of America Securities put 2026 year-to-date Non-QM issuance at $57 billion as of late June 2026, against $80 billion for full-year 2025, and forecast roughly $100 billion for 2026. Outlets covering the same Bank of America report disagree on the 2025 origination base — HousingWire published $108 billion, National Mortgage News published $100 billion — so both are reported here rather than one being chosen.
Credit is the other half of the sentence. Fitch Ratings put 30-plus-day delinquency in the NQM/Non-Prime 2.0 sector at 7.26% and 90-plus-day delinquency at 3.61% on February 2026 remittance data, up 118 and 81 basis points year over year respectively. Those are two different buckets and are stated separately here on purpose. Separately, dv01, a Fitch Ratings company, put total impairments — loans delinquent or actively modified, a broader measure than delinquency — at 6.7% on May 2026 data, up 30 basis points month over month, with the deterioration concentrated in bank statement and self-employed collateral while debt-service-coverage-ratio investor loans held near 6% and full-documentation loans actually improved.
No Fitch or dv01 release with an as-of date later than May 2026 had been published in the trade press as of August 24, 2026. Any August-dated Non-QM credit figure you see this week is not coming from those sources.
The contrarian part: the rate you quote is being subsidized by a spread
The 30-year mortgage rate is 7 basis points higher than it was a year ago — 6.65% on Thursday, August 20, 2026 against 6.58% on Thursday, August 21, 2025 — while the 10-year U.S. Treasury is 36 basis points higher over the same Thursday-to-Thursday span. The difference did not come from nowhere. It came out of the spread.
30-year fixed mortgage rate less the 10-year U.S. Treasury constant-maturity yield, Thursday closes. Sources: Freddie Mac Primary Mortgage Market Survey; Federal Reserve H.15 and U.S. Treasury daily par yield curve. Every plotted value appears in the table below.
| Comparison week | 30-yr mortgage | 10-yr Treasury | Spread |
|---|---|---|---|
| Thu Aug 21, 2025 | 6.58% | 4.33% | 225 bps |
| Thu Aug 13, 2026 | 6.67% | 4.63% | 204 bps |
| Thu Aug 20, 2026 | 6.65% | 4.69% | 196 bps |
A 29-basis-point compression over twelve months is what has kept the quoted rate roughly flat through a meaningful Treasury selloff. It is real, and it is finite. Spread compression is a stock, not a flow: once it is spent, the mortgage rate tracks the Treasury move one-for-one. The same compression is visible on the securitization side of the non-agency market — Bank of America Securities put Non-QM AAA spreads at 120 basis points in late June 2026, and A&D Mortgage’s fourth non-agency securitization of 2026 priced its AAA tranche at 135 basis points against initial talk in the 140 range, two times oversubscribed, per National Mortgage News on June 26, 2026. Asset Securitization Report flagged on August 11, 2026 that excess spread has been falling across mortgage securitizations, though it published no figure for the magnitude.
Here is why that matters more in Orange County than almost anywhere. The marginal Orange County borrower is no longer an agency borrower. In the second quarter of 2026 the average non-agency loan recorded in the county was $2,193,462, and non-agency took 43.4170% of the dollars. That loan is not priced off a Fannie Mae guarantee fee and a to-be-announced mortgage-backed security. It is priced off a bank’s balance sheet appetite or a securitization bid — and those bids key off the long end of the curve, which just closed at its highest since 2007. The half of Orange County’s market that is growing is the half most exposed to the part of the curve that is breaking.
The counter-argument, stated properly
The strongest case against the above is that the bid for non-agency paper is structural rather than opportunistic. Insurers bought $19 billion of residential mortgage-backed bonds and $13 billion of residential whole loans in the first quarter of 2026, of which $7 billion was Non-QM, per Bank of America Securities — against an annuity issuance run-rate near $100 billion a quarter. That is a liability-driven buyer matching long-dated, prepayment-protected, high-coupon assets to long-dated liabilities. Rising long-end yields make that trade better, not worse. On that reading, tight Non-QM spreads are a durable re-rating of the asset class, not froth, and the compression can persist.
Two things temper it. Fitch’s ‘Bsf’ rating-case default expectation for the 2025 Non-QM vintage is 17.7% to 17.76% depending on the outlet, while realized cumulative losses across vintages are roughly 3.6 basis points on about $281 billion originated since 2018. That gap is not evidence of credit quality. It is evidence of light seasoning and excess spread doing its job — and excess spread is exactly what Asset Securitization Report says is thinning. And the February 2026 monitor is being read two different ways. Scotsman Guide quotes Fitch directly: the increases “indicate continued collateral deterioration across all NQM vintages.” National Mortgage News, covering the same report, frames it in its own editorial voice as a reversion to the norm rather than a significant concern — that phrasing is the outlet’s, not Fitch’s, and the Fitch analyst quoted there says only that it “brings it more in line with our expectations.” Same report, two different readings, and only one of them is a Fitch quotation.
There is also an honest limit on our own local finding. The non-agency dollar share rose from the first quarter to the second quarter in all five geographies we tested — Orange County +4.68 percentage points, Los Angeles County +3.14, California statewide +3.57, Texas +2.08, Florida +1.65. Some of that is a seasonal purchase-mix effect, not an Orange County story. What is not seasonal is the magnitude: Orange County’s non-agency dollar share rose 1.51 percentage points from the first quarter to the second in 2025, and 4.68 points in 2026, three times the prior year’s move, on a falling total loan count.
| Geography | Q1 2026 | Q2 2026 | Change |
|---|---|---|---|
| Orange County, CA | 38.74% | 43.42% | +4.68 pp |
| Los Angeles County, CA | 34.68% | 37.82% | +3.14 pp |
| California statewide | 28.89% | 32.46% | +3.57 pp |
| Texas statewide | 12.32% | 14.40% | +2.08 pp |
| Florida statewide | 19.00% | 20.65% | +1.65 pp |
What to do with this, by seat
For the agent
Stop describing Orange County listings above $1.4 million as “jumbo financing” and stop describing everything below as “conforming.” The band from $832,750 to $1,249,125 is high-balance conforming — agency money, agency rates, tighter overlays. Knowing that a $1.15 million purchase with 20% down is an agency loan, not a jumbo, is worth real basis points to your buyer and real credibility to you.
For the self-employed borrower
The credit box is bifurcating by documentation type, not by borrower quality. dv01’s May 2026 data shows full-documentation impairments improving while every alternative-documentation type deteriorated. If you can qualify on returns, do — the pricing gap is widening. If you cannot, Freddie Mac’s Bulletin 2026-10, dated August 5, 2026, cuts the asset-depletion divisor from 240 months to 180 and opens investment properties to asset-based qualifying, effective February 3, 2027 with early adoption permitted. That is a genuinely larger agency door.
For the investor
Debt-service-coverage-ratio ratio floors have tightened — sub-1.0x now generally requires offsetting liquidity, documentation or lower leverage, where 0.65x to 0.75x once cleared. Product availability has not contracted; the terms on it have. Meanwhile DSCR collateral is the best-behaving segment in the sector, holding near 6% impairment since early 2025. If you are buying in Orange County, price the deal against the long end, not the 10-year.
For the originator
Your Orange County agency pipeline shrank 12.29% in dollars last quarter and your non-agency pipeline grew 6.43%. If your product mix does not reflect that, you are competing for the shrinking half. Non-QM was more than 10% of national locks in July 2026. In Orange County, non-agency is 43.4170% of the dollars. That is the gap between the national conversation and your market.
Three lines you can use
“Orange County recorded 10,569 mortgages last quarter, down 6.44% from the first quarter — the first spring decline in four years. All of it was agency. Non-agency dollars actually grew.”
“Non-agency lending is one in six Orange County loans and 43.4170% of the dollars. If your lender does not do that business well, they are not really in this market.”
“The 30-year mortgage rate is only 7 basis points above last year, but the 10-year Treasury is 36 higher. That gap is spread compression, and it is not a renewable resource.”
What we are watching
- The next Fitch U.S. RMBS Performance Monitor. The most recent one covered by the trade press uses February 2026 remittance data. Six months is a long time in a deteriorating vintage.
- Excess spread. Asset Securitization Report flagged it falling on August 11, 2026 without a figure. A quantified read on that is the single most useful Non-QM datapoint available this autumn.
- The 2027 conforming loan limits, expected from the Federal Housing Finance Agency in late November 2026. Orange and Los Angeles Counties are both pinned at the 150% ceiling, so their limits will move with the national baseline, not with local price appreciation.
- The Consumer Financial Protection Bureau’s Ability-to-Repay and Qualified Mortgage review, listed at the pre-rule stage on the 2026 regulatory agenda. Pre-rule means no text and no effective date — but it is the item with the largest potential effect on this sector.
- Orange County construction lending, which fell from 484 recorded loans in the second quarter of 2025 to 167 in the second quarter of 2026, down 65.50%. We are not publishing a thesis on it until we have ruled out a recording change.
- The next Orange County recording quarter. If the third quarter of 2026 confirms the break rather than reversing it, the seasonal pattern is gone rather than late.
Frequently asked questions
What is the 2026 conforming loan limit in Orange County, California?
The 2026 one-unit conforming loan limit in Orange County, California is $1,249,125, the high-cost area ceiling. The national baseline one-unit limit is $832,750. The Federal Housing Finance Agency announced both on November 25, 2025. Los Angeles County carries the same $1,249,125 ceiling.
How much did Orange County mortgage lending fall in the second quarter of 2026?
Orange County recorded 10,569 mortgages worth $8,795,681,056 in the second quarter of 2026, down 6.44% by count and 5.04% by dollars from the 11,296 loans and $9,262,086,953 recorded in the first quarter of 2026, per ModelMatch county recording data retrieved August 24, 2026.
Is a decline from the first quarter to the second quarter normal in Orange County?
No. Orange County loan counts rose from the first quarter to the second quarter in each of the three prior years: 25.91% in 2023, 24.05% in 2024 and 21.75% in 2025. The 6.44% decline in 2026 is the first such decline in four years, per ModelMatch county recording data retrieved August 24, 2026.
What share of Orange County mortgage dollars is non-agency?
Non-agency loans were 43.4170% of Orange County mortgage dollars recorded in the second quarter of 2026 – $3,818,818,162 of $8,795,681,056 – and 16.4727% of the loan count, per ModelMatch county recording data retrieved August 24, 2026.
What is the average non-agency loan size in Orange County?
The average Orange County non-agency loan recorded in the second quarter of 2026 was $2,193,462, computed as $3,818,818,162 across 1,741 loans, per ModelMatch county recording data retrieved August 24, 2026.
Does high-balance conforming count as non-agency?
No. High-balance conforming loans are agency loans. They are delivered to Fannie Mae and Freddie Mac, priced above baseline conforming and underwritten to tighter overlays, but they are not non-agency. In this brief, high-balance conforming is counted with agency. The non-agency set used here sits roughly 97% above the $1,249,125 Orange County high-cost ceiling.
Why did the 30-year mortgage rate fall while Treasury yields rose?
Mortgage spreads compressed. The 30-year fixed mortgage rate averaged 6.65% on Thursday, August 20, 2026, only 7 basis points above the 6.58% of Thursday, August 21, 2025, while the 10-year U.S. Treasury rose 36 basis points over the same span, from 4.33% to 4.69%. The premium of the mortgage rate over the 10-year Treasury narrowed from 225 basis points to 196 basis points, absorbing most of the Treasury move.
How are Non-QM delinquencies trending in 2026?
Rising. Fitch Ratings put 30-plus-day delinquency in the NQM/Non-Prime 2.0 sector at 7.26% and 90-plus-day delinquency at 3.61% on February 2026 remittance data, up 118 and 81 basis points year over year. dv01, a Fitch Ratings company, put total impairments – delinquent or actively modified, a broader measure than delinquency – at 6.7% on May 2026 data, up 30 basis points month over month.
How large is the Non-QM market in 2026?
Bank of America Securities projected $175 billion of Non-QM originations in 2026 and put 2026 year-to-date Non-QM securitization at $57 billion as of late June 2026, forecasting roughly $100 billion for the full year. Outlets covering the same Bank of America report disagree on the 2025 origination base: HousingWire published $108 billion and National Mortgage News published $100 billion. Both figures are reported here.
What is the TW Rate Environment Score this week?
The TW Rate Environment Score was 51 out of 100, described as Balanced, for the week of August 21, 2026, down 4 points from 55 the prior week.
Definitions
- Agency loan
- A mortgage eligible for purchase by Fannie Mae or Freddie Mac. Includes both baseline conforming loans and high-balance conforming loans.
- Baseline conforming limit
- The national one-unit loan limit set annually by the Federal Housing Finance Agency. $832,750 for 2026.
- High-balance conforming
- An agency loan above the baseline limit but at or below the local high-cost ceiling. Still delivered to Fannie Mae or Freddie Mac, priced higher, and subject to tighter overlays. $832,750 to $1,249,125 in Orange and Los Angeles Counties for 2026.
- High-cost area ceiling
- The maximum one-unit conforming limit in designated high-cost counties, set at 150% of the baseline. $1,249,125 for 2026 in Orange and Los Angeles Counties.
- Non-agency loan
- A mortgage not eligible for delivery to Fannie Mae or Freddie Mac. In this brief, loans flagged non-conforming in ModelMatch county recording data, roughly 97% of which sit above the $1,249,125 high-cost ceiling.
- Non-QM
- Non-Qualified Mortgage. A loan that does not meet the Consumer Financial Protection Bureau’s Qualified Mortgage standard, typically because income is documented by bank statements, profit-and-loss statements or property cash flow rather than tax returns and W-2s.
- DSCR loan
- Debt-Service-Coverage-Ratio loan. An investment-property mortgage qualified on the property’s rental cash flow relative to its debt service rather than on the borrower’s personal income.
- 30-plus-day delinquency
- The share of loans at least 30 days past due. A broader and earlier measure than 90-plus-day delinquency; the two are different measures and are not interchangeable.
- 90-plus-day delinquency
- The share of loans at least 90 days past due, also called serious delinquency.
- Impairment (dv01)
- dv01’s measure of loans that are either delinquent OR actively modified. Broader than delinquency; it must not be compared directly with a delinquency figure.
- NQM/Non-Prime 2.0
- Fitch Ratings’ sector label for post-crisis Non-QM and non-prime residential mortgage-backed securities. One sector, not two definitions.
- Basis point
- One hundredth of one percentage point. 100 basis points equals 1.00%.
- Mortgage spread
- The difference between the 30-year fixed mortgage rate and a benchmark Treasury yield, expressed in basis points.
- Excess spread
- The interest collected on a securitization’s collateral above what is owed to bondholders and to fees. It absorbs early losses before any bondholder is written down.
- RMBS
- Residential Mortgage-Backed Securities.
- PMMS
- Freddie Mac’s Primary Mortgage Market Survey, a weekly lender survey of average offered mortgage rates, released Thursdays at noon Eastern.
Share this brief
Forward it to one agent and one investor. That is how this gets useful.
Get it every Monday
Sources
- ModelMatch county mortgage recording data, Orange County and Los Angeles County, California; quarterly, trailing 24 months Retrieved August 24, 2026
- Freddie Mac Primary Mortgage Market Survey, release of August 20, 2026 August 20, 2026 https://www.freddiemac.com/pmms
- Freddie Mac PMMS archive (August 13, 2026 and August 21, 2025 releases) Retrieved August 24, 2026 https://www.freddiemac.com/pmms/pmms_archives
- Federal Reserve Statistical Release H.15, Selected Interest Rates Release dated August 21, 2026, covering through August 20, 2026 https://www.federalreserve.gov/releases/h15/
- U.S. Department of the Treasury, Daily Treasury Par Yield Curve Rates Retrieved August 24, 2026 https://home.treasury.gov/resource-center/data-chart-center/interest-rates/TextView?type=daily_treasury_yield_curve
- TW Rate Report, week of August 21, 2026 August 21, 2026 https://twteam.com/rate-report
- Federal Housing Finance Agency, Conforming Loan Limit Values for 2026 Announced November 25, 2025 https://www.fhfa.gov/news/news-release/fhfa-announces-conforming-loan-limit-values-for-2026
- Federal Open Market Committee, minutes of the July 28-29, 2026 meeting Released August 19, 2026 https://www.federalreserve.gov/monetarypolicy/fomcminutes20260729.htm
- Federal Open Market Committee statement, July 29, 2026 July 29, 2026 https://www.federalreserve.gov/newsevents/pressreleases/monetary20260729a.htm
- U.S. Department of the Treasury, Increased Sizes of Nominal Long-End Liquidity Support Buybacks Beginning September 9 Announced August 19, 2026 https://home.treasury.gov/news/press-releases/sb0607
- Fitch Ratings U.S. RMBS Performance Monitor, February 2026 remittance data, via MBA Newslink, National Mortgage Professional and National Mortgage News Report as-of February 2026; covered March and April 2026 https://www.scotsmanguide.com/news/non-qm-delinquencies-rise-but-sector-looks-stable/
- dv01, a Fitch Ratings company, Non-Agency RMBS Benchmarks, May 2026 data, via Scotsman Guide Report as-of May 2026; published July 6, 2026 https://www.scotsmanguide.com/news/non-qm-gaps-widen-between-full-doc-and-alt-doc-loans/
- Bank of America Securities Non-QM origination and issuance estimates, via HousingWire Published June 30, 2026 https://www.housingwire.com/articles/non-qm-originations-175b-2026/
- Bank of America Securities Non-QM issuance and spread data, via National Mortgage News Published June 29, 2026 https://www.nationalmortgagenews.com/news/non-qm-issuance-on-record-pace-helped-by-fumbo-mortgages
- Optimal Blue Market Advantage, July 2026 lock data, via National Mortgage Professional Data as-of July 2026; published August 11, 2026 https://nationalmortgageprofessional.com/news/higher-rates-cool-july-mortgage-locks-while-non-qm-pushes-past-10
- Home equity and Non-QM summer RMBS pipeline, Asset Securitization Report Published August 11, 2026 https://asreport.americanbanker.com/news/home-equity-non-qm-deals-dominate-summer-rmbs
- Non-QM vintage risk and DSCR underwriting, National Mortgage News Published June 26, 2026 https://www.nationalmortgagenews.com/news/non-qm-check-how-vintage-risk-is-reshaping-dscr-underwriting
- California Association of Realtors, July 2026 Home Sales and Price Report Data as-of July 2026; released August 17, 2026 https://www.car.org/aboutus/mediacenter/newsreleases/2026releases/July2026HomeSales
- Freddie Mac Single-Family Seller/Servicer Guide Bulletin 2026-10, asset-based income Bulletin dated August 5, 2026; effective February 3, 2027 https://guide.freddiemac.com/ci/okcsFattach/get/1010693_7
Taylor Weiner, NMLS 263090. The TW Team, Seal Beach, California.
This brief is provided for informational and educational purposes only. It is not a commitment to lend, an offer of credit, a rate lock, or a guarantee of any rate, term, program or approval. All loan programs, rates, terms and conditions are subject to change without notice and to credit approval, underwriting, property appraisal and program eligibility. Not all applicants will qualify. Figures described as recorded county data reflect recordings captured as of the retrieval date and are subject to revision as additional recordings post. Third-party figures are attributed to their sources and are reproduced as published; where sources disagree, both values are shown. Nothing here is investment, legal, tax or accounting advice.