
By Taylor Weiner, Mortgage Loan Originator, NMLS 263090 Published Data through Q2 2026
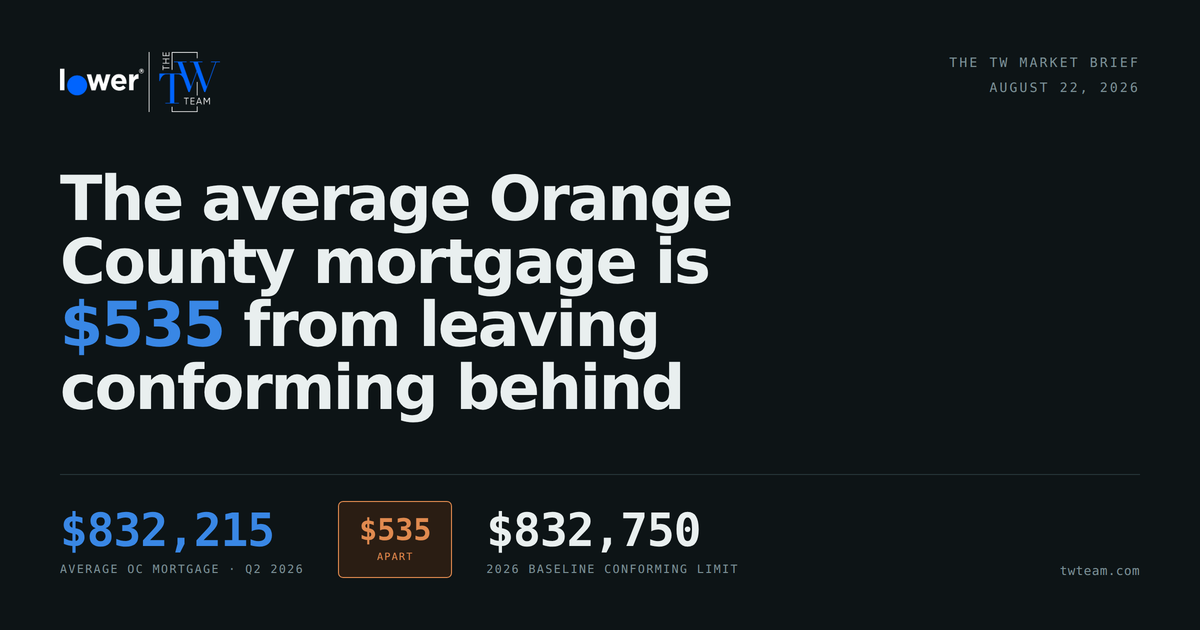
In the second quarter of 2026, the average mortgage recorded in Orange County was $832,215. The 2026 baseline conforming loan limit is $832,750.
Five hundred and thirty-five dollars. At the current pace, the average Orange County borrower becomes a high-balance borrower sometime this quarter — and most people writing offers in this county have not adjusted for it.
Q2 2026
Single unit
Agency lending in this high-cost county runs to $1,249,125 — but the pricing changes at $832,750.
A word on what that does and doesn’t mean, because this gets muddled constantly. Orange County is a high-cost area, so agency lending here doesn’t stop at $832,750 — it runs to $1,249,125. What happens at $832,750 is that a loan leaves baseline conforming and becomes high-balance: still agency, still Fannie and Freddie, but priced higher, with tighter overlays and a smaller lender set. Above $1,249,125 you leave agency entirely.
Three rungs. The average borrower in this county is about to step onto the second one.
Key findings — week of August 22, 2026
- The average mortgage recorded in Orange County, California was $832,215 in Q2 2026, $535 below the 2026 baseline conforming loan limit of $832,750.Model Match county recording data; FHFA 2026 limits
- Orange County is a high-cost area, so agency lending continues to $1,249,125. Above $832,750 a loan becomes high-balance conforming — still agency, but priced higher and underwritten tighter.FHFA 2026 high-cost area ceilings
- Non-conforming loans were 15.8% of Orange County loan count and 40.6% of dollar volume over the trailing twelve months, growing 8.1% year over year against 1.9% for the county overall.Model Match, TTM through Q2 2026
- United States Non-QM originations are projected at $175 billion for 2026, against $108 billion in 2025 — growth of 62%, or 75% if you take National Mortgage News’ reading of the same note, which puts the 2025 base at $100 billion.Bank of America Securities note, late June 2026, via HousingWire and National Mortgage News
- Non-QM 30+ day delinquency reached 7.26%, up 118 basis points year over year. The 2024 vintage sits at 3.71% 90+ day against 1.18% for 2025.Fitch U.S. RMBS Performance Monitor, February 2026 remittance data
- Cumulative Non-QM losses since 2018 total 3.6 basis points across approximately $281 billion of originations, blended across vintages and lightly seasoned at the recent end — a repricing, not a credit crisis.Bank of America Securities note, late June 2026, via HousingWire
Loan sizes climbed 14%. The baseline rose 3%.
Orange County’s average recorded mortgage rose from $729,542 in Q4 2024 to $832,215 in Q2 2026 — up 14.1% — while the baseline conforming loan limit rose 3.3% to $832,750 for 2026.
In the fourth quarter of 2024, the average Orange County mortgage was $729,542 against a baseline limit headed for $806,500 — a comfortable cushion. The headroom didn’t disappear because of one dramatic quarter. It closed steadily, over seven of them.
Average Orange County mortgage vs. the baseline conforming limit
Recorded mortgage volume ÷ units, by quarter · Model Match
| Quarter | Average OC loan |
|---|---|
| Q4 2024 | $729,542 |
| Q1 2025 | $732,658 |
| Q2 2025 | $775,819 |
| Q3 2025 | $772,845 |
| Q4 2025 | $818,117 |
| Q1 2026 | $819,944 |
| Q2 2026 | $832,215 |
The top of the ladder tells the same story. Over the trailing twelve months Orange County recorded 38,746 mortgages totaling $31.8 billion. Loans that cleared agency limits entirely were 15.8% of the count — and 40.6% of the dollars.
The growth rate is the tell. Total county loan count grew 1.9% year over year. Non-conforming count grew 8.1%, more than four times faster. This market isn’t getting busier. It’s getting bigger per transaction, and all of the growth sits at the top of the ladder.
Rates didn’t cause this, and they aren’t going to fix it
The 30-year fixed-rate mortgage averaged 6.65% on August 20, 2026 — two basis points below the prior week and seven basis points above a year earlier, per Freddie Mac. The 10-year Treasury closed the week at 4.68%, up 42 basis points from August 2025.
| Instrument | Current | Prior week | Year ago |
|---|---|---|---|
| 30-year fixed | 6.65% | 6.67% | 6.58% |
| 15-year fixed | 5.95% | 5.96% | 5.69% |
| 10-year Treasury | 4.68% | 4.65% | 4.26% |
| TW Rate Environment Score | 51 | 55 | — |
Mortgage rates: Freddie Mac Primary Mortgage Market Survey, August 20, 2026. 10-year Treasury: FRED series DGS10 Friday closes — August 14, 2026 and August 7, 2026; the year-ago figure is the Federal Reserve H.15 monthly average for August 2025. The TW Rate Environment Score is a 0–100 composite and has no year-ago comparison in this series yet.
The Score came in at 51 this week — Balanced — down four points across a genuinely volatile stretch that included FOMC minutes and real movement in the long end. That is 2026 in one line: twelve months of noise, no direction. Anyone waiting on rates to solve an affordability problem has now been waiting a year for a move that never came — in either direction.
Non-QM is having its best year on record
Bank of America Securities projects $175 billion in United States Non-QM originations for 2026, against $108 billion in 2025, with roughly 70% of production securitized.
Securitization issuance is forecast near $100 billion, up from $80 billion, with roughly $57 billion already printed year to date. Those securitization figures are the firmer half of the picture — two trade outlets covering the same BofA note agree on them, while their accounts of 2025 origination volume differ by $8 billion, which is why the growth rate above carries a range. That aside, the direction is the story: this stopped being a balance-sheet cottage industry and became a functioning capital markets channel.
If you’re wondering why every wholesale rep in Southern California suddenly wants to talk about bank statement and DSCR programs — that’s why. The bid is real, and it’s coming from insurers with roughly $100 billion a quarter of annuity inflows that have to go somewhere. Bank of America Securities counted $19 billion of RMBS bonds and $13 billion of residential whole loans bought by insurers in the first quarter of 2026, with $7 billion of those whole loans in Non-QM.
Volume grew 62%. Credit quietly got worse.
Non-QM 30+ day delinquency reached 7.26% on February 2026 remittance data, up 118 basis points year over year, with the deterioration concentrated in the 2023 and 2024 origination vintages.
Here is where this brief departs from every other Non-QM piece you’ll read this month. Separately, dv01 — a Fitch Ratings company — showed 30-day-plus impairments rising 22 basis points in April 2026, the fifth increase in six months. Impairment is the broader measure: it counts loans that are delinquent or carrying an active modification, so it moves on workout activity as well as missed payments. The damage is not evenly spread.
Non-QM 90+ day delinquency by origination vintage
Fitch U.S. RMBS Performance Monitor · NQM / Non-Prime 2.0 · February 2026 remittance data
| Vintage | 90+ day delinquency | Year-over-year |
|---|---|---|
| 2024 | 3.71% | +2.31 pts |
| 2025 | 1.18% | +1.18 pts |
Underwriting has already responded. Megan Castleton, chief credit officer at Constructive Capital, notes that DSCR ratios as low as 0.65 to 0.75 were accepted pre-pandemic; today anything below 1.0 typically requires offsetting factors. That is a meaningful repricing of the marginal investor deal, and it happened without a press release.
Why this is a repricing, not a crisis
Cumulative Non-QM losses since 2018 total 3.6 basis points across approximately $281 billion of originations — roughly 1,000 loans out of 580,000 have produced losses above $10,000.
One caveat on that number, because it is the most quotable figure in this brief and the most easily misused: 3.6 basis points is blended across every vintage from 2018 to today, and the recent vintages carrying the delinquency problem are barely seasoned. Losses lag delinquency by quarters, not weeks. The figure is real and it is low; it is not yet a verdict on the 2023 and 2024 books.
Delinquency is rising off a floor so low the sector still outperforms almost anyone’s underwriting. Borrowers with real equity in appreciating Southern California collateral don’t default into losses — they sell, or they cure. What’s happening is that the market is separating one bad vintage’s problems from the product category’s fundamentals, and capital is staying on tighter terms.
The practical translation: the money is still here, the box is narrower, and the difference between an approval and a decline is increasingly the quality of the file — not the appetite of the lender.
What this means, depending on who you are
If you’re a listing agent
Two thresholds matter here, not one. Above $832,750 your buyer is high-balance — still agency, but priced differently and underwritten tighter. Above $1,249,125 they’re out of agency altogether, which is where two in five mortgage dollars in this county already fund.
Neither is a financing contingency problem. Both are product problems, and those get solved before the offer goes out. Ask your lender which rung a file lands on before you write.
If you’re self-employed
The window on 2023-style flexibility is closing, but the door isn’t shut. Bank statement programs are still funding — they’re simply priced and documented more carefully than they were eighteen months ago.
Two years of clean, consistent deposits is now worth real basis points. A strong 2025 and a strong first half of 2026 is the file to bring, and bringing it now beats bringing it in six months.
If you’re an investor
The sub-1.0 DSCR deal that penciled in 2023 doesn’t pencil today without compensating factors — more down, more reserves, or a stronger credit profile. Plan for it.
The upside: the capital behind DSCR lending is deeper and more institutional than it has ever been, so deals that clear the box clear it fast.
If you’re an originator
Half your market by dollar volume is now non-agency, and the credit box moved under your feet in the last four quarters.
The people who take share in the back half of 2026 will be the ones who can look at a file on the first call and say which of six channels it belongs in.
Three lines to use this week
What we’re watching next week
Jackson Hole commentary and its read-through to the long end. The next Fitch RMBS remittance update, for whether the 2025 vintage holds its advantage. And Orange County’s Q3 recording pace — which will tell us whether the average loan finally crosses the baseline conforming limit outright.
The TW Rate Report updates every Friday with the full macro and rate picture.
Frequently asked questions
What is the average mortgage amount in Orange County, California?
The average mortgage recorded in Orange County, California was $832,215 in the second quarter of 2026, calculated as total recorded mortgage volume divided by recorded units. That is up 14.1% from $729,542 in the fourth quarter of 2024. Source: Model Match county recording data through Q2 2026.
What is the 2026 conforming loan limit in Orange County, California?
Orange County has two 2026 thresholds because it carries a high-cost designation. The baseline conforming loan limit is $832,750 for a one-unit property. The high-balance conforming ceiling for Orange County and Los Angeles County is $1,249,125. A loan above $1,249,125 is a jumbo or non-agency mortgage.
What is the difference between baseline conforming, high-balance conforming, and jumbo loans?
They are three rungs of the same ladder. A baseline conforming loan is at or below $832,750 in 2026 and receives standard agency pricing. A high-balance conforming loan sits above $832,750 and up to the local high-cost ceiling — $1,249,125 in Orange and Los Angeles Counties — and is still purchased by Fannie Mae and Freddie Mac, but carries a rate premium, tighter overlays, and a smaller lender set. A jumbo loan exceeds the high-cost ceiling and is not agency-eligible, funding through portfolio lenders or private securitization instead.
How large is the Non-QM mortgage market in 2026?
Bank of America Securities projects $175 billion in United States Non-QM originations for 2026. HousingWire reports the 2025 base at $108 billion (62% growth); National Mortgage News, covering the same note, reports $100 billion (75% growth). Securitization issuance is forecast near $100 billion for 2026, up from $80 billion in 2025, with approximately $57 billion completed year to date. Roughly 70% of Non-QM production is securitized.
Are Non-QM mortgage delinquencies rising in 2026?
Yes. Fitch’s U.S. RMBS Performance Monitor puts NQM / Non-Prime 2.0 30+ day delinquency at 7.26%, up 118 basis points year over year, on February 2026 remittance data. On the 90+ day measure the 2024 vintage sits at 3.71% and the 2025 vintage at 1.18%. The 2023 vintage carries 30+ day delinquency of 10.95%, up 2.55 percentage points. Separately, dv01 — a Fitch Ratings company — recorded 30+ day impairments rising 22 basis points in April 2026, the fifth increase in six months; impairment counts loans that are delinquent or under an active modification, so it is a broader measure than delinquency.
Is the Non-QM market heading for a credit crisis?
The loss data does not support that reading. Across approximately $281 billion of Non-QM originated and securitized since 2018, cumulative losses total 3.6 basis points. Out of roughly 580,000 loans, approximately 1,000 have produced losses exceeding $10,000. Delinquency is rising from an unusually low base, and the pattern is better described as a repricing concentrated in the 2023 vintage than as a systemic credit event.
What DSCR ratio do you need to qualify for an investor loan in 2026?
Most lenders now require a debt service coverage ratio of at least 1.0, and anything below 1.0 typically requires offsetting factors such as a larger down payment, additional reserves, or a stronger credit profile. Before the pandemic, DSCR ratios as low as 0.65 to 0.75 were commonly accepted, according to Megan Castleton, chief credit officer at Constructive Capital.
What percentage of Orange County mortgages are non-conforming?
Over the trailing twelve months through Q2 2026, non-conforming loans were 15.8% of Orange County recorded mortgages by count and 40.6% by dollar volume — 6,123 loans averaging $2.11 million each, out of 38,746 total mortgages worth $31.8 billion. Non-conforming loan count grew 8.1% year over year against 1.9% for the county overall.
What are mortgage rates in August 2026?
As of the August 20, 2026 Freddie Mac Primary Mortgage Market Survey, the 30-year fixed-rate mortgage averaged 6.65%, down from 6.67% the prior week and up from 6.58% a year earlier. The 15-year fixed averaged 5.95%. The 10-year Treasury closed Friday, August 14, 2026 at 4.68% per FRED series DGS10.
Definitions
Non-QM mortgage
A residential mortgage that does not meet the CFPB’s Qualified Mortgage standard, underwritten with alternative income documentation such as bank statements, asset depletion, or property cash flow rather than tax returns and W-2s.
DSCR loan
An investor mortgage qualified on the property’s debt service coverage ratio — rental income divided by the loan payment — rather than the borrower’s personal income. A ratio of 1.0 means rent exactly covers the payment.
Bank statement loan
A Non-QM mortgage for self-employed borrowers that qualifies income from 12 to 24 months of personal or business bank deposits rather than from tax returns.
Baseline conforming loan limit
The national maximum eligible for standard Fannie Mae and Freddie Mac purchase, set annually by the FHFA. The 2026 one-unit baseline is $832,750.
High-balance conforming loan
An agency-eligible mortgage above the baseline limit but at or below a high-cost area ceiling. Still agency, but priced with a rate premium and tighter overlays. The 2026 one-unit ceiling in Orange and Los Angeles Counties is $1,249,125.
Jumbo mortgage
A mortgage exceeding the applicable conforming loan limit for its county, ineligible for agency purchase and funded instead by portfolio lenders or private securitization.
Loan vintage
The calendar year a group of loans was originated. Vintage analysis compares delinquency and loss performance across origination years to isolate the effect of underwriting standards and the rate environment at the time.
Get the TW Market Brief every Monday
Original Orange County and LA County loan data, the week’s rate picture, and what’s actually moving in Non-QM. Written for agents, investors, and originators. One email a week.
No spam, no lead-selling, unsubscribe any time.
Sources
- Freddie Mac Primary Mortgage Market Survey — rates as of August 20, 2026
- TW Rate Report — Rate Environment Score, Treasury and macro data, week of August 21, 2026
- FRED — 10-Year Treasury Constant Maturity (DGS10)
- HousingWire — Non-QM origination and securitization forecasts, reporting a Bank of America Securities note of late June 2026
- National Mortgage News — second account of the same BofA note, used to cross-check origination volumes
- MBA Newslink — Fitch U.S. RMBS Performance Monitor, February 2026 remittance data
- Federal Reserve H.15 — 10-year Treasury constant maturity, August 2025 monthly average
- National Mortgage News — DSCR underwriting and vintage risk, June 26, 2026
- National Mortgage Professional — Fitch U.S. RMBS Performance Monitor delinquency by vintage
- Model Match loan records — Orange County, CA, trailing twelve months through Q2 2026
Taylor Weiner Team · NMLS 263090 · Equal Housing Opportunity.
Market data is provided for informational purposes and is not a commitment to lend or a guarantee of rate, terms, or approval. Rates and program guidelines are subject to change without notice.